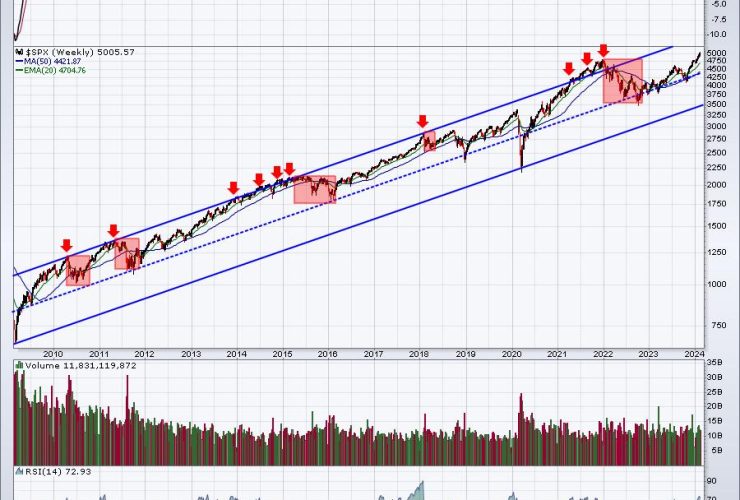
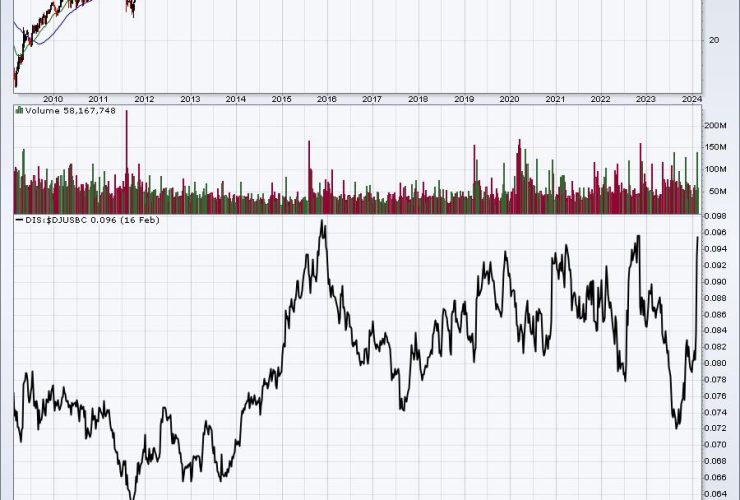
The masses have been confounded by the strength of this current secular bull market. Too many keep betting against it and they’ve cost themselves a huge opportunity for profit as prices have soared. I’ve pointed out on many occasions that ...
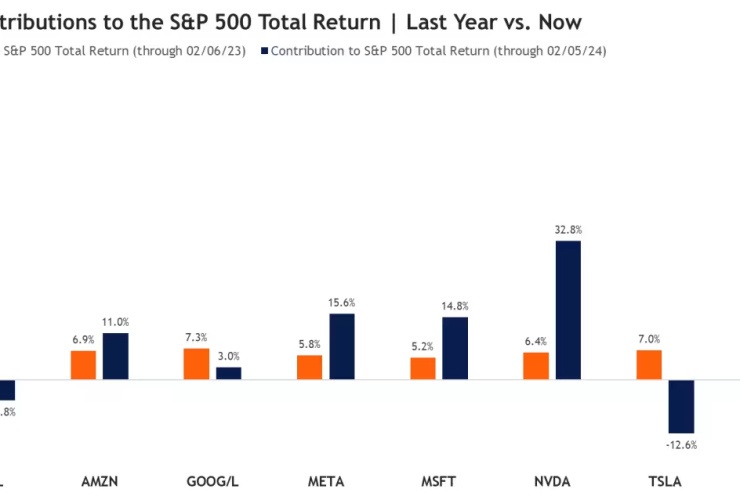
Going into last week, the Magnificent Seven stocks were looking more like the Magnificent Four. Leadership within the group became more concentrated, with Amazon, Meta, Microsoft and Nvidia having done most of the heavy lifting. This is far different from ...
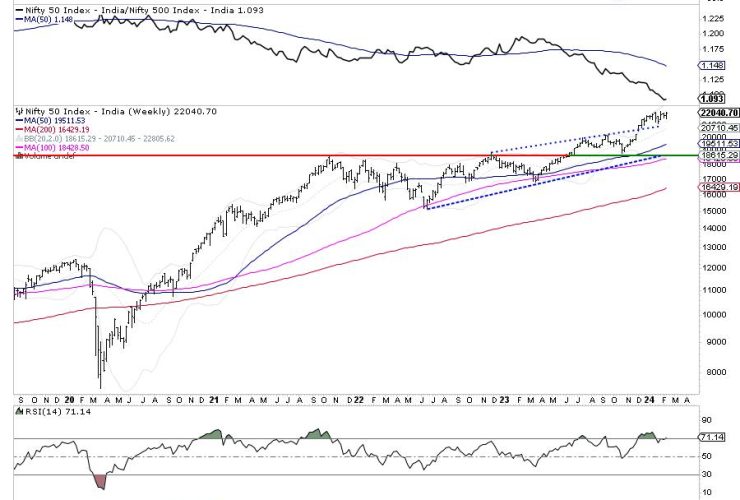
Some serious consolidation continued in the markets as the Nifty oscillated in a defined range before closing the week with modest gains. Examination of daily charts shows that the Nifty tested its 50-DMA again and rebounded from that level while ...
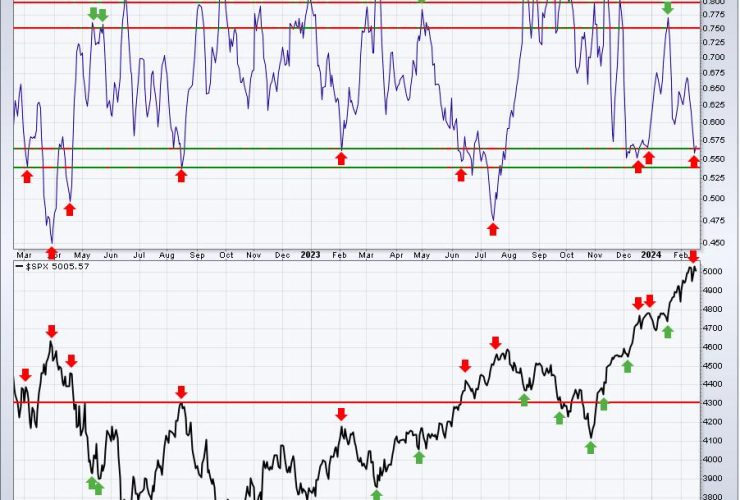
While many analysts follow sentiment signals that involve feelings about market direction, I prefer one that follows the MONEY. I want to know what retail traders are doing with their money with respect to options. Extreme readings provide eerily accurate ...
The momentum phenomenon has been a fixture in the US equity markets for decades. There are two types of momentum to consider: absolute momentum and relative momentum. Absolute momentum refers to the underlying trend, up or down. Relative momentum quantifies ...
A Buying Climax typically concludes a long term uptrend. The rally phase from the October low of 2023 has these climactic characteristics. This advance comes after a major trend that began in late 2022. The steady upward march in the ...
BETA One of the Risk ON/OFF metrics I like to keep an eye on is BETA. From Investopedia: Beta (β) is a measure of the volatility—or systematic risk—of a security or portfolio compared to the market as a whole (usually the ...
We’re one day away from “DRAFT Day”! Every quarter, we select the 10 equal-weighted stocks that will comprise our 3 portfolios – Model, Aggressive, and Income. My background is in public accounting as I audited companies in the Washington, DC ...
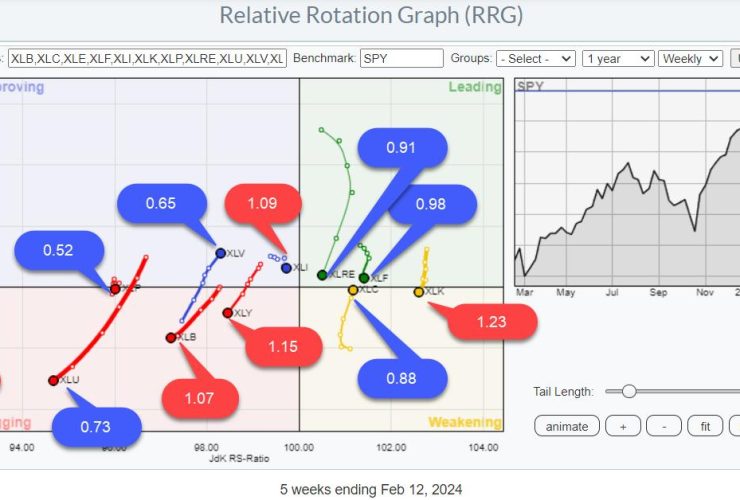
On this episode of StockCharts TV’s Sector Spotlight, I separate the 11 sectors in the S&P 500 into Offensive, Defensive, and Sensitive, assessing their group rotational patterns to see if there is any alignment with the current technical condition of the ...
In this edition of StockCharts TV‘s The Final Bar, Dave focuses on AAPL which closed below its 200-day moving average as it tests key price support. Guest Jesse Felder of The Felder Report reports on the Titanic Syndrome, a market breadth indicator ...


